
Trading System
Set forth below is a detailed description of the Monaco Day Trader Trading System.
Objective
- The objective of the Trading System is to make a minimum daily profit of 1%.
Strategy
- The Trading System is a trend following system using 500:1 leverage trading a limited selection of target markets.
- Trades are both Long and Short profiting from small price changes.
Time Frame
- This is not high-frequency trading.
- Trades are made with the expectation of a quick exit. The exit might be within 60 seconds although a longer time frame with an exit within 10 minutes is also part of the strategy.
- Trades are generally not held overnight.
Trend Following
- The Trading System seeks to identify trends as they emerge. As a trend becomes apparent a trade will be executed with the expectation that the holding period will be within 10 minutes. Often multiple trades will be made during the same trend with entry/exit in close succession. Sometimes a multi-trade position will be built by “layering in” with several trades.
- Exit of trades is generally into weakening strength with the trend still intact or hesitating.
News & Fundamental Analysis
- At the start of each day a review is made of the timing of important scheduled news events (e.g. Federal Reserve interest rate decisions, U.S. non-farm payroll data, inflation data, etc.). The preference is not to have any positions in the market when market-moving news is expected.
- As U.S. corporate announcements such as earnings releases are usually made after the New York close this generally has little impact on the Trading System so long as there are no significant positions held overnight..
- Fundamental analysis of the trend-following system is not a significant feature
Broker Platform
- CFD broker – Vantage Markets
- Platform – MetaTrader 4
- Account – Raw ECN USD
Target Markets
The main reason to trade only 10 markets is to keep focus. There’s plenty of scope to make profit by trading only this limited number of highly liquid targets. Bonds, stocks and commodities are not traded.
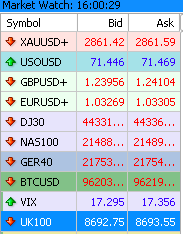
The Trading System only trades the following 10 target markets:
- XUAUSD (Gold)
- USOUSD (WTI Crude Oil)
- EUR/USD Currency Pair
- GBP/USD Currency Pair
- DJ30 (Dow Jones)
- NAS100 (NASDAQ)
- GER40 (German DAX)
- UK100 (FTSE)
- BTC (Bitcoin)
- VIX (Volatility)
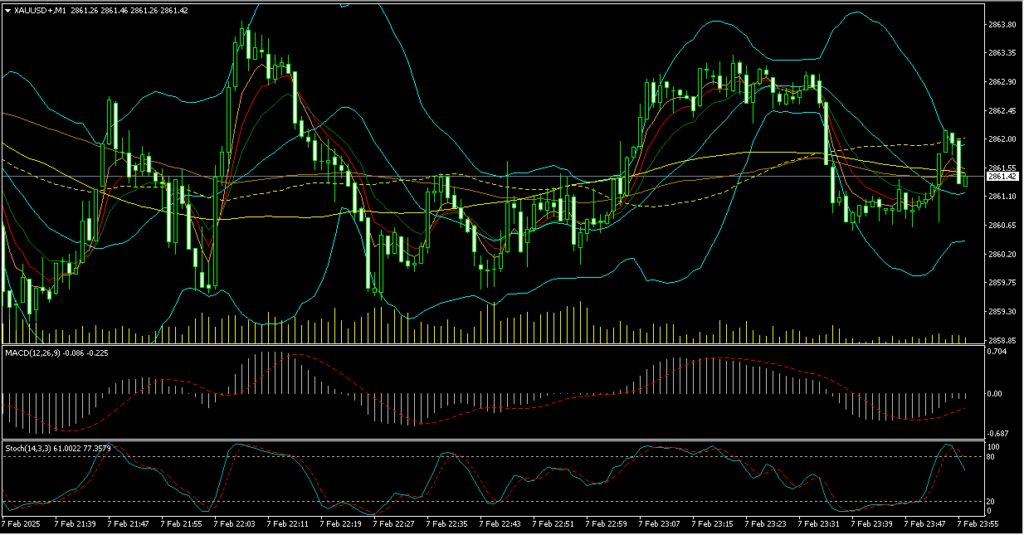
Technical Indicators
The following technical indicators are used in some or all charts:
- Bollinger Bands 20 2
- Exponential Moving Average 5 (pink)
- Exponential Moving Average 8 (red)
- Exponential Moving Average 13 (green)
- Simple Moving Average 55 (yellow dotted)
- Simple Moving Average 89 (sandy)
- Simple Moving Average 200 (yellow)
- MACD 12 26 9
- OsMA 12 26 9
- Stochastics 14 3 3
- RSI 14
- Volume (histogram, A/D, OBC, MFI)
See the Technical Indicators section for a full description of the foregoing.
Single Chart
The following chart is the bedrock of the Trading System.
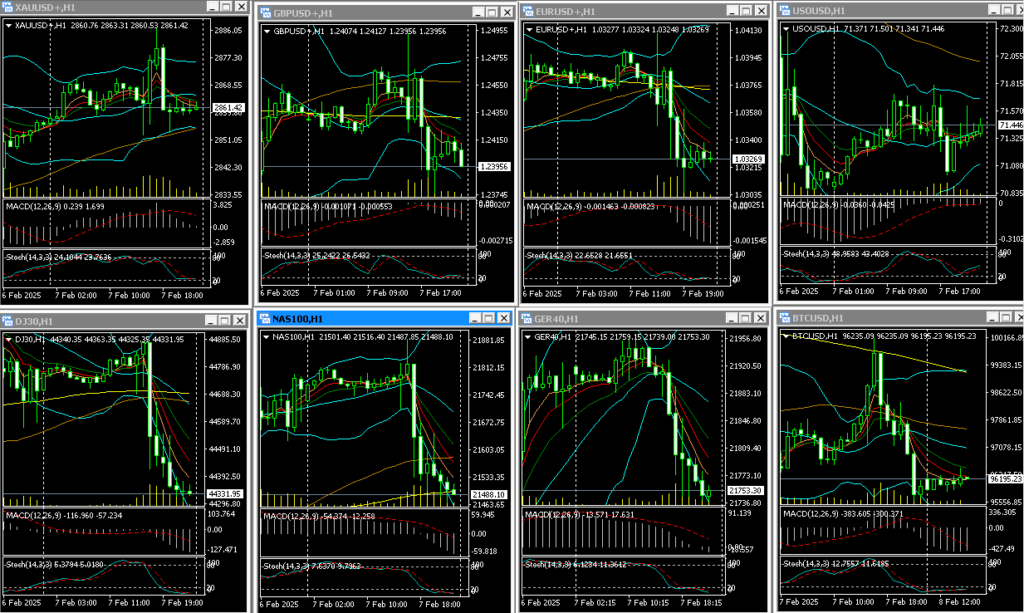
8 Target Markets
Eight of the ten target markets are arranged in a profile on the same screen.
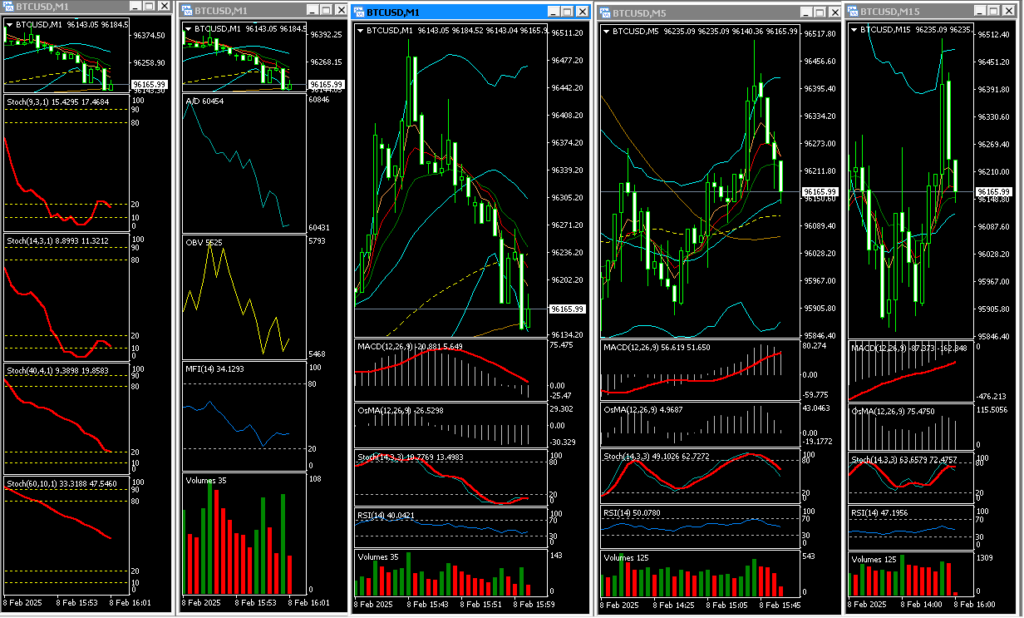
Single Target Market Chart
When a target is seriously considered for trade entry or exit the profile below is used in an attempt to fine turn the execution.
Trading Methodology
- Remember, trading with leverage of 500:1 is nitroglycerin. Highly dangerous if not treated with the greatest respect.
- At the start of each morning before trading review the 10 target markets. Start with the Daily (D1) profile and then step down the time frame to the Hour (H1) profile and so on to the Minute (M1) profile. Repeat this process multiple times each day. The reason for doing this is to develop a feeling as to the trends in each of the targets in each time frame. Obviously for any given target the trend in the time frames will often be in conflict. For example, the trend apparent on the H1 chart might be up whilst the M5 chart shows a down trend.
- Check for scheduled events such as data releases, news announcements and speeches. A good source for this information is fxstreet.com. It is advisable to be out of the market when events are scheduled. Markets can move dramatically. Better to be out of the market as it is impossible to predict what direction markets will take when a scheduled event occurs.
- Expect volatility at 09:00 hours when the European markets open and at 15:30 (09:30 EST) hours when New York opens. Volatility can also be significant during the runup to the New York market close at 22:00 (16:00 EST).
- The foundation of the Trading System is trend following. It is not based on detailed fundamental analysis. It is not trying to anticipate the reaction of the market to a scheduled event. The goal is to take action after the scheduled event occurs. At best the news output of media such as CNBC are of general interest and do not form a reliable basis for trading decisions. In essence the idea is that everything that is known is already in the market price. The Trading System is designed to react to trends as they start to form and ultimately die.
- Continuously reviewing the 8-chart profile in various time frames will reveal potential targets multiple times every hour. As CFD trading is available outside normal market hours it’s not necessary to be glued to the computer screen 23 hours/day. Sleeping, eating and socialising are desirable and indeed necessary. The Trading System does not require or expect continued presence in the market. However, when a trade is “live” the trader must be in front of the screen and totally focussed on the task on hand. Toilet breaks and grabbing a coffee are fine. Going off to lunch is not. Do not expect to make a profit whilst asleep, eating in a restaurant or shopping.
- When a target is selected for more detailed review switch to the Single Market Target profile. This shows 5 charts of the same target. From right to left: time frames M15, M5, M1, Volume, Kurisko Stochastics.
- There are a couple of old trader sayings “… the trend is your friend” and “… bulls live above the line, bears live below the line”. Traditionally the “line” refers to a daily chart with the 200-day simple moving average. Recognising the trend is an essential element of the Trading System. For this a simple letter system can be used on all charts in all time frames. When the current price is above the 20-period SMA this is referred to as 1A. If the 8-period EMA is above the 20-period SMA this is a 2A condition. If the current market price is above the 8-period EMA this is a 3A condition. This implies a strong uptrend in price on the chart under review. Conversely if price is below the 20-period SMA the condition is 1B. If the 8-period EMA is below the 20-period SMA this is a 2B condition. If the current market price is below the 8-period EMA this is a 3B condition. This implies a strong downtrend in price on the chart under review.
- Trade execution whether buy or sell generally takes place on the Single Market Target profile. Before execution the Kurisko stochastics on the left chart should be reviewed. The 4 charts of this section show an enhanced view of the M1 stochastics with each chart having a different time frame. The lowest chart (60-10 parameters) gives a clue as to whether the envisaged trade has a low risk. In other words a “low hanging fruit”. When the stochastic is below the 20% look out for an uptrend to develop. When the stochastic is above 80% look out for a downtrend.
- Whilst viewing the Single Market Target profile take a close look at the OsMA histogram. When the histogram approaches or crosses the zero line this can be the final trigger needed to execute the envisaged trade. Crossing up over the zero line implies an uptrend. Conversely, crossing down under the zero line implies a downtrend.
- Prices don’t move in straight lines. Typically in all time frames they appear to “stairstep” up or down. With a trend underway it can be attractive to enter/exit multiple times. Each time grabbing a small profit and awaiting a modest pullback ready to enter a trade again. If the trend appears strong without significant pullback then “layering in” can be an attractive way to build a multi-trade position ready to exit by “layering out” or exiting all positions at the same time.
- Losses – these are the problem. Small loses have a habit of becoming large with the inevitable result that the trading account is blown up. There will be good days when everything seems to work wonderfully. Other days it’s the opposite. Getting used to this is a challenge but it’s impossible to be right all the time.
- Protect capital. Exiting a losing trade is somehow motionally uplifting. It’s a relief to stop the pain. Having the courage to exit losing trades before they become lethal is a necessity. Practice makes perfect, hopefully.
Trading Rules - Technical
Let your winners run and cut your losers quickly. Yeah, right. Easier said than done. Remember, profits are not a problem – losses are the problem when trading with 500:1 leverage. Here are some general rules:
- No single position to exceed 10% of equity.
- Set theoretical stop losses on individual trades at no more than 5 – 10% of equity.
- Total positions not to exceed 20% of equity.
- If equity is down 10% consider exiting everything and stop trading today. Maybe today is simply not your day. Don’t blow up your account today so you’ll be around tomorrow.
- Be careful of holding multiple targets that are correlated. Correlation is a two-edged sword.
- Margin Level less than 200% spells danger. Get ready to exit all positions.
- Don’t try to be the Big Kahuna. Gradually “layer in” a profitable position by taking multiple small positions as the trade goes in your favour.
- There must be three technical reasons for entering a trade.
- Stochastics can stay overbought or oversold seemingly forever. Keep alert – look for the crossover that will eventually come.
- Pay attention when price is outside the Bollinger Bands on charts of all timescales. Price will have a tendency to reverse or move sideways so the next candle is inside the Bollinger Band.
- Narrow Bollinger Bands indicate sideways move. Keep awake and be ready for the action.
- When the moving averages look like spaghetti …. relax, stay out.
- Beware divergence of the individual currency pairs or indices. Better to trade when correlated.
- Weak $ = strong gold. Right? Yeah, but never when you really need it!
- Check the time as planned announcements are usually made on the quarter/half/hour.
- Watch out for candlestick reversals precisely on the 15M-30M-45M-1H times frames.
- Keep an eye on volume. After a decent move often volume will slack off. Maybe the target will catch it’s breath and move sideways waiting for the moving averages to catch up before continuing the move. Or maybe a reversal is in the offing. It’s tricky.